Close Menu
Think Money Wise
  • HOME
  • BANK
    • BUDGET
  • BONDS
  • INVESTEMENT
  • FINANCE
    • MICROFINANCE
  • RETIREMENT
  • STOCKS
  • TAX PLANNING
What's Hot

Bond Economics: Postal Savings Banks

April 3, 2026

When Payrolls Matter Most | EI Blog

April 3, 2026

The Greens, antisemitism and antiZionism

April 3, 2026
Facebook X (Twitter) Instagram
Think Money Wise
  • HOME
  • BANK
    • BUDGET
  • BONDS
  • INVESTEMENT
  • FINANCE
    • MICROFINANCE
  • RETIREMENT
  • STOCKS
  • TAX PLANNING
Think Money Wise
Home»INVESTEMENT»Early Signs of a Crack in the Back of the Nasdaq 100 Index Rally?
INVESTEMENT

Early Signs of a Crack in the Back of the Nasdaq 100 Index Rally?

Editorial teamBy Editorial teamAugust 22, 2025No Comments2 Mins Read
Facebook Twitter Pinterest LinkedIn Tumblr Email
Early Signs of a Crack in the Back of the Nasdaq 100 Index Rally?
Share
Facebook Twitter LinkedIn Pinterest Email


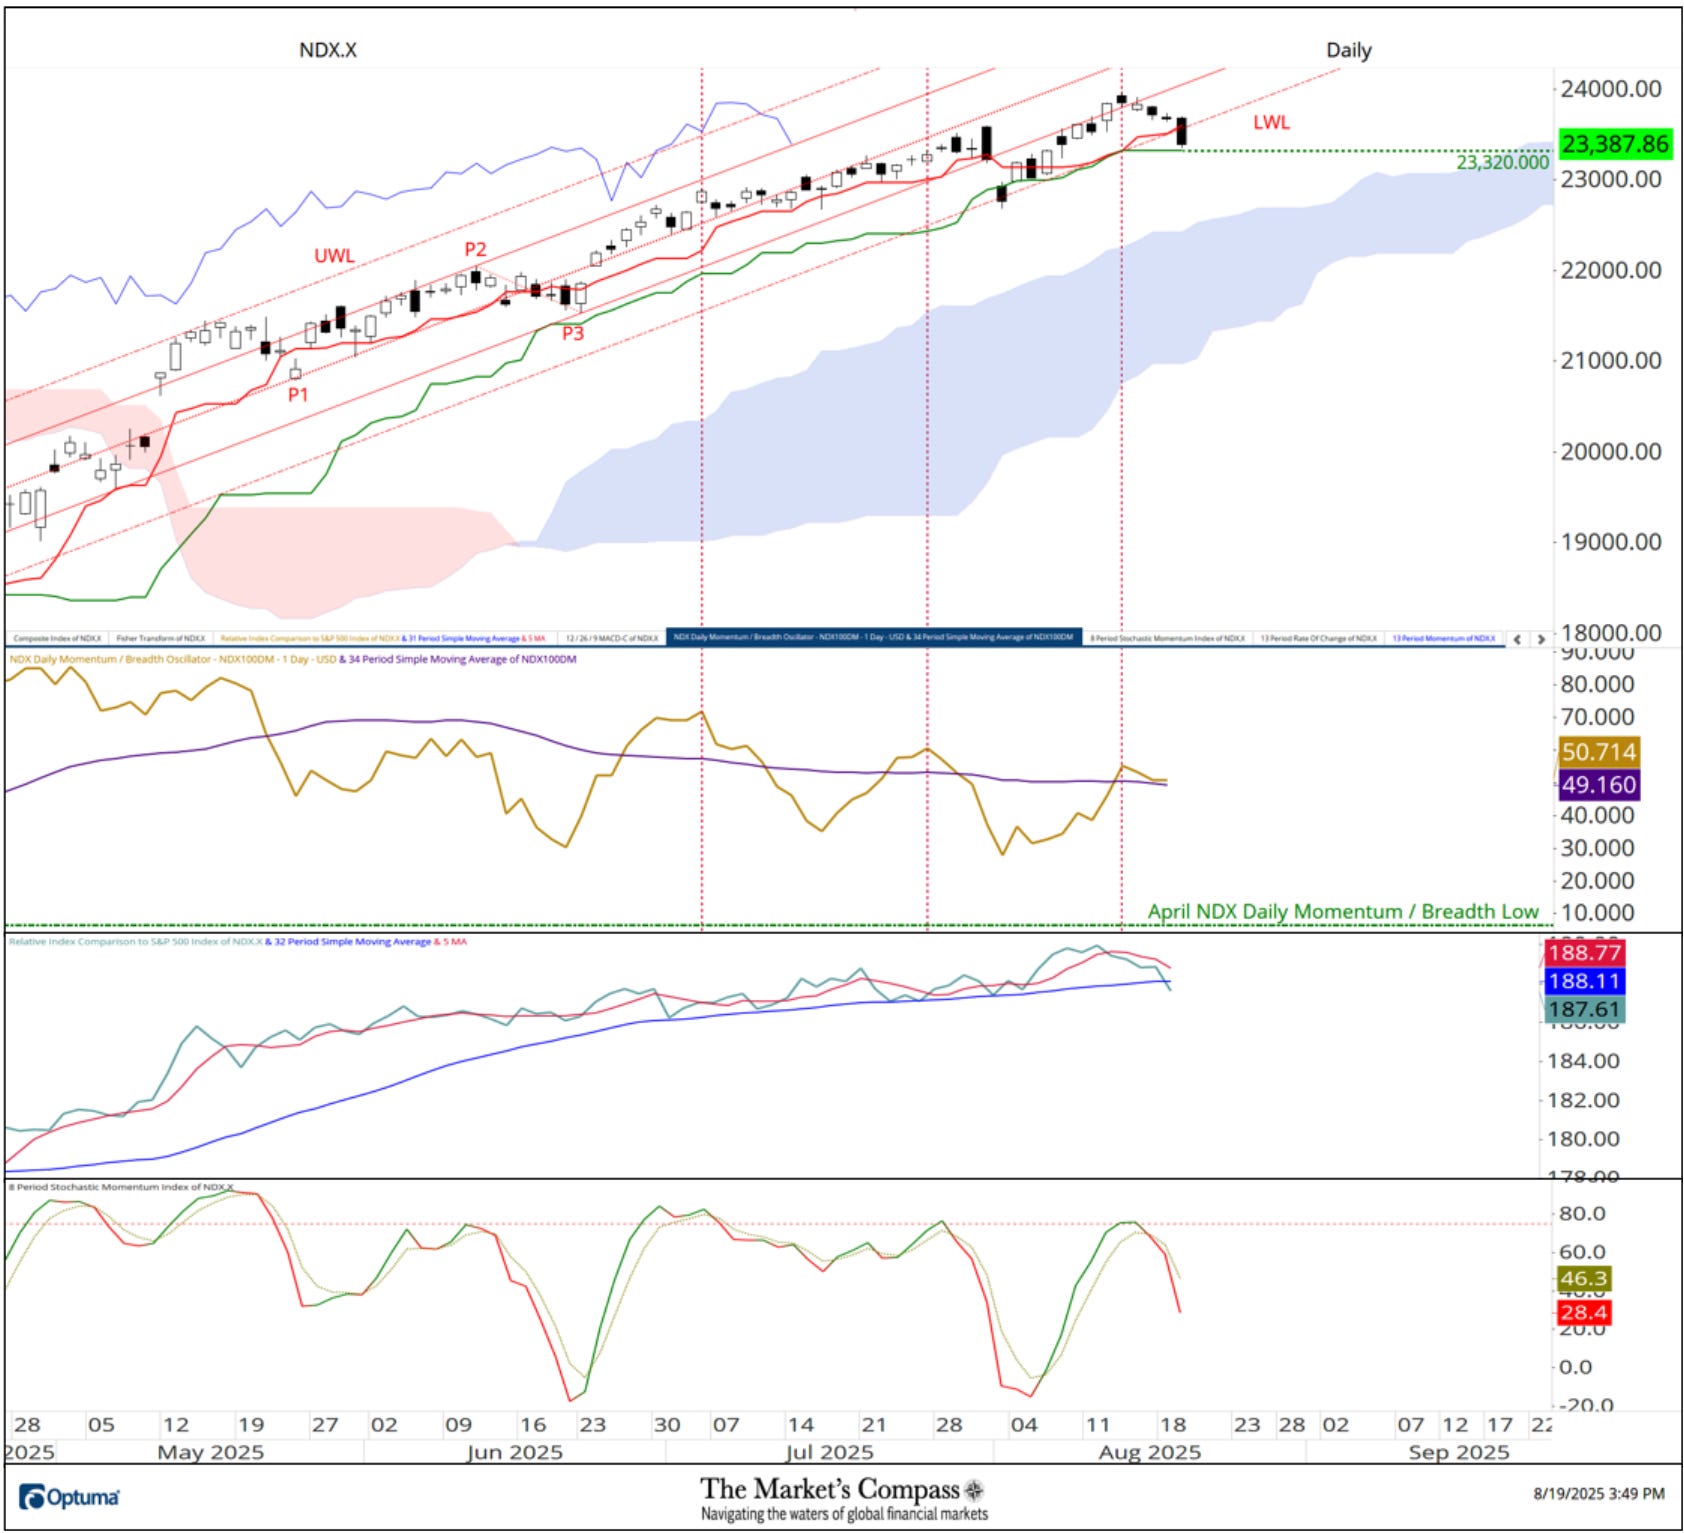
At the risk of being labeled the boy that cried wolf, there are early signs of a crack in the back of the NASDAQ 100 Index’s rally. These include a violation of the Lower Warning Line (dashed red line, LWL) of the Standard Pitchfork (red P1 through P3) after failing to hold the retaken ground above the Lower Parallel (sold red line). I know I’ve been beating a dead horse for weeks, but there continues to be a repeated non-confirmation of the higher price highs in the Momentum / Breadth Oscillator (dashed yellow lines). Not only does it reflect deterioration in upside momentum, but it also speaks to decaying breadth. There are early signs of a break of the trend in relative outperformance versus the SPX as witnessed by a drop below its longer-term moving average (blue line) for the first time in months (a drop of the shorter-term moving average, red line through the longer, would confirm the breakdown). There has been a sharp turn lower in the Stochastic Momentum Index (bottom panel) that at the very least suggests a potential deeper price retracement than we have seen in months. There is no question that I am sticking my neck out with this warning considering that over the next three days there could be news driven volatility in the rates market that will likely overflow into the equity markets. Key support is at the Kijun Plot (green line at 23,320) and second at Cloud support.


Source link

Share. Facebook Twitter Pinterest LinkedIn Tumblr Email
hinafazil44
Editorial team
  • Website

Related Posts

When Payrolls Matter Most | EI Blog

April 3, 2026

Finally Revealing My #1 Trading Secret

April 2, 2026

Blackstone Raises Record US$6.3 Billion for Largest Life Sciences Fund

April 1, 2026
Leave A Reply Cancel Reply

Top Posts

Bond Economics: Postal Savings Banks

April 3, 2026

When Payrolls Matter Most | EI Blog

April 3, 2026

The Greens, antisemitism and antiZionism

April 3, 2026

Why tax season is turning into a debt trap for Canadians (and how to avoid it)

April 3, 2026

Subscribe to Updates

Please enable JavaScript in your browser to complete this form.
Loading
About Us

Welcome to Think Money Wise, your trusted source for practical financial insights, money management tips, and strategies to build a secure and informed financial future. Our mission is to simplify financial knowledge and empower you to make informed decisions about saving, investing, and managing your money with confidence.

Top Posts

Bond Economics: Postal Savings Banks

April 3, 2026

When Payrolls Matter Most | EI Blog

April 3, 2026

The Greens, antisemitism and antiZionism

April 3, 2026
Subscribe to Updates

Please enable JavaScript in your browser to complete this form.
Loading
  • About Us
  • Contact Us
  • Disclaimer
  • Privacy Policy
  • Terms and Conditions
Copyright © 2026 Thinkmoneywise. All Right Reserved

Type above and press Enter to search. Press Esc to cancel.