

The Moving Average Convergence/Divergence (MACD) is a popular technical analysis tool used by traders to identify trends and potential trend reversals in financial markets. Developed by Gerald Appel in the late 1970s, the MACD has become one of the most widely used indicators among technical analysts.
However, many traders today are moving beyond traditional lagging tools like MACD in search of more responsive, non-repainting solutions that align with real-time price action. If you’re exploring how to complement—or even upgrade—from classic oscillators, consider professional alternatives like Magic Histogram — a next-generation MetaTrader 5 indicator designed for accurate, timely signals without the drawbacks of moving averages or delayed responses.
In this article, we will delve deeper into the MACD indicator, exploring its components, calculation, and interpretation. We will also discuss different trading strategies that traders can use with the MACD indicator to make better trading decisions.
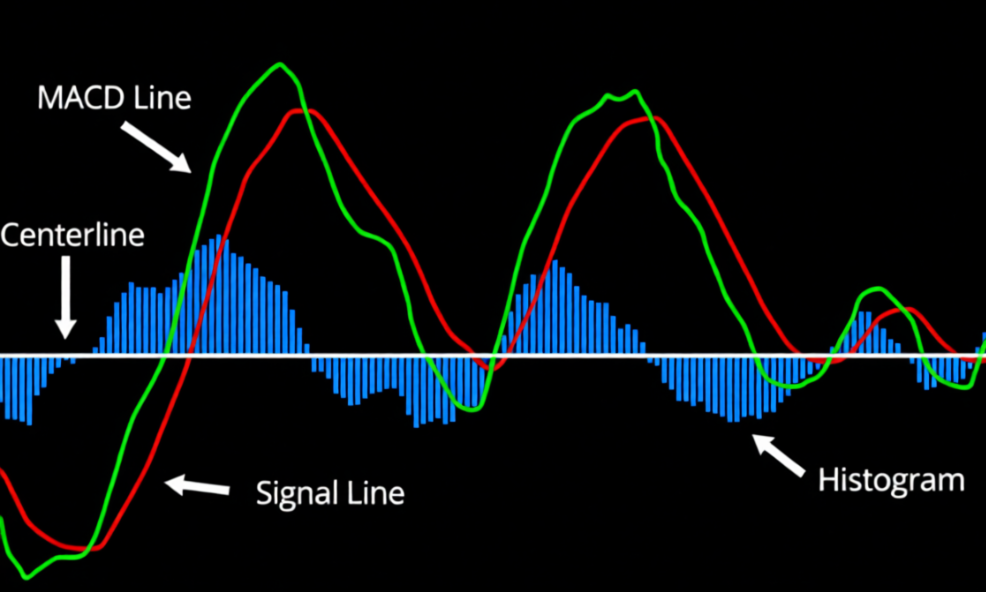
The MACD indicator consists of three components:
My solutions on MQL5 Market: Evgeny Belyaev’s products for traders
-
MACD Line: The MACD line is the difference between two exponential moving averages (EMAs). The most commonly used EMAs are the 12-period EMA and the 26-period EMA. The MACD line is calculated by subtracting the 26-period EMA from the 12-period EMA.
-
Signal Line: The signal line is a moving average of the MACD line. The most commonly used signal line is the 9-period EMA. The signal line is plotted on top of the MACD line, and it is used to generate buy and sell signals.
-
Histogram: The histogram is a visual representation of the difference between the MACD line and the signal line. When the MACD line crosses above the signal line, the histogram is positive, indicating a bullish trend. Conversely, when the MACD line crosses below the signal line, the histogram is negative, indicating a bearish trend.
Calculating the MACD Indicator
The MACD indicator is calculated using the following formula:
MACD Line = 12-Period EMA – 26-Period EMA
Signal Line = 9-Period EMA of the MACD Line
Histogram = MACD Line – Signal Line
Interpreting the MACD Indicator
Traders use the MACD indicator to identify trend direction, trend strength, and potential trend reversals. Here are some key interpretations of the MACD indicator:
-
Crossovers: When the MACD line crosses above the signal line, it is considered a bullish signal, indicating a potential trend reversal from bearish to bullish. Conversely, when the MACD line crosses below the signal line, it is considered a bearish signal, indicating a potential trend reversal from bullish to bearish.
-
Divergences: When the MACD line diverges from the price, it can signal a potential trend reversal. A bullish divergence occurs when the price makes a lower low, but the MACD line makes a higher low. A bearish divergence occurs when the price makes a higher high, but the MACD line makes a lower high.
-
Histogram: The histogram can be used to identify the strength of the trend. When the histogram is positive and increasing, it indicates a strong bullish trend. When the histogram is negative and decreasing, it indicates a strong bearish trend.
-
Zero Line: The zero line is an important level for the MACD indicator. When the MACD line crosses above the zero line, it indicates a shift from bearish to bullish. When the MACD line crosses below the zero line, it indicates a shift from bullish to bearish.
Trading Strategies with the MACD Indicator
Here are three trading strategies that traders can use with the MACD indicator:
-
Crossover Strategy: This strategy is based on the MACD line crossing above or below the signal line. When the MACD line crosses above the signal line, it is a buy signal, and when the MACD line crosses below the signal line, it is a sell signal. Traders can use the crossover strategy to enter and exit trades.Divergence Strategy: This strategy is based on the idea that divergences between the MACD indicator and the price can signal potential trend reversals. Traders can use bullish divergences to identify potential buy opportunities and bearish divergences to identify potential sell opportunities.
-
To identify bullish divergences, traders look for situations where the price is making a lower low, but the MACD line is making a higher low. This suggests that the underlying trend may be shifting from bearish to bullish. Conversely, to identify bearish divergences, traders look for situations where the price is making a higher high, but the MACD line is making a lower high. This suggests that the underlying trend may be shifting from bullish to bearish.
Traders can use divergences to confirm potential trend reversals identified by other technical indicators or price action patterns. For example, if a trader identifies a potential double bottom pattern on a price chart, they can look for a bullish divergence on the MACD indicator to confirm the potential reversal.
To use this strategy, traders can enter long positions when the histogram is positive and increasing and exit those positions when the histogram begins to decrease. Conversely, traders can enter short positions when the histogram is negative and decreasing and exit those positions when the histogram begins to increase.
It is important to note that the MACD indicator is not infallible and should be used in conjunction with other technical indicators and fundamental analysis. Traders should also be aware of the limitations of the indicator, such as its tendency to generate false signals in choppy or sideways markets.
-
Trend Strength Strategy: This strategy is based on the idea that the histogram can be used to identify the strength of the trend. When the histogram is positive and increasing, it indicates a strong bullish trend, and when the histogram is negative and decreasing, it indicates a strong bearish trend. Traders can use the trend strength strategy to enter and exit trades based on the strength of the trend.