
Overview
Volatility Master is a powerful MetaTrader indicator designed to help traders identify volatile and trending markets while avoiding low-volatility ranges. With its intuitive dashboard and actionable signals, this tool enhances trading decisions and boosts confidence in market analysis.
© 2025 Intraquotes.
Latest Version: MT4 – 1.12 | MT5 – 1.8
Installation and Setup
Step 1: Download the indicator from the MQL5 marketplace.
Step 2: Open MetaTrader 4, Open Terminal > Click on the ‘Purchased’ tab > Click on the ‘Install’ button to install the indicator.
Step 3: Restart MT4 and open the ‘Navigator’ > Click on the ‘Market’.
Step 4: Drag and drop Volatility Master onto your chart.
Indicator Features
✔️ Dashboard Layout:
-
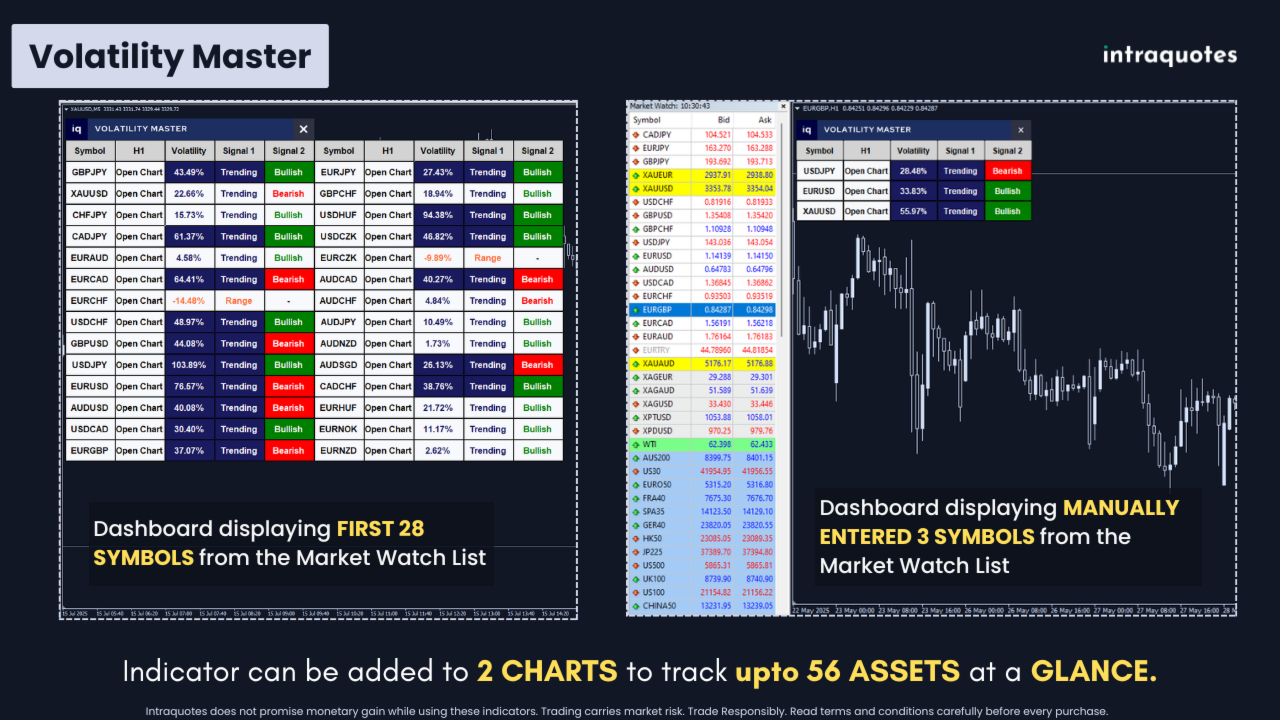
Displays up to 28 symbols from the Market Watch.
-
One-click instant chart open option.
-
Displays volatility in percentages.
-
Provides two signals:
➡️ Signal 1: Indicates if the market is in a trend or a range.
➡️ Signal 2: Indicates whether the trend is bullish or bearish.
The one-click-instant chart open option is under the Timeframe tab labelled as ‘Open Chart’.
How does the indicator work?
✔️ Signals Interpretation:
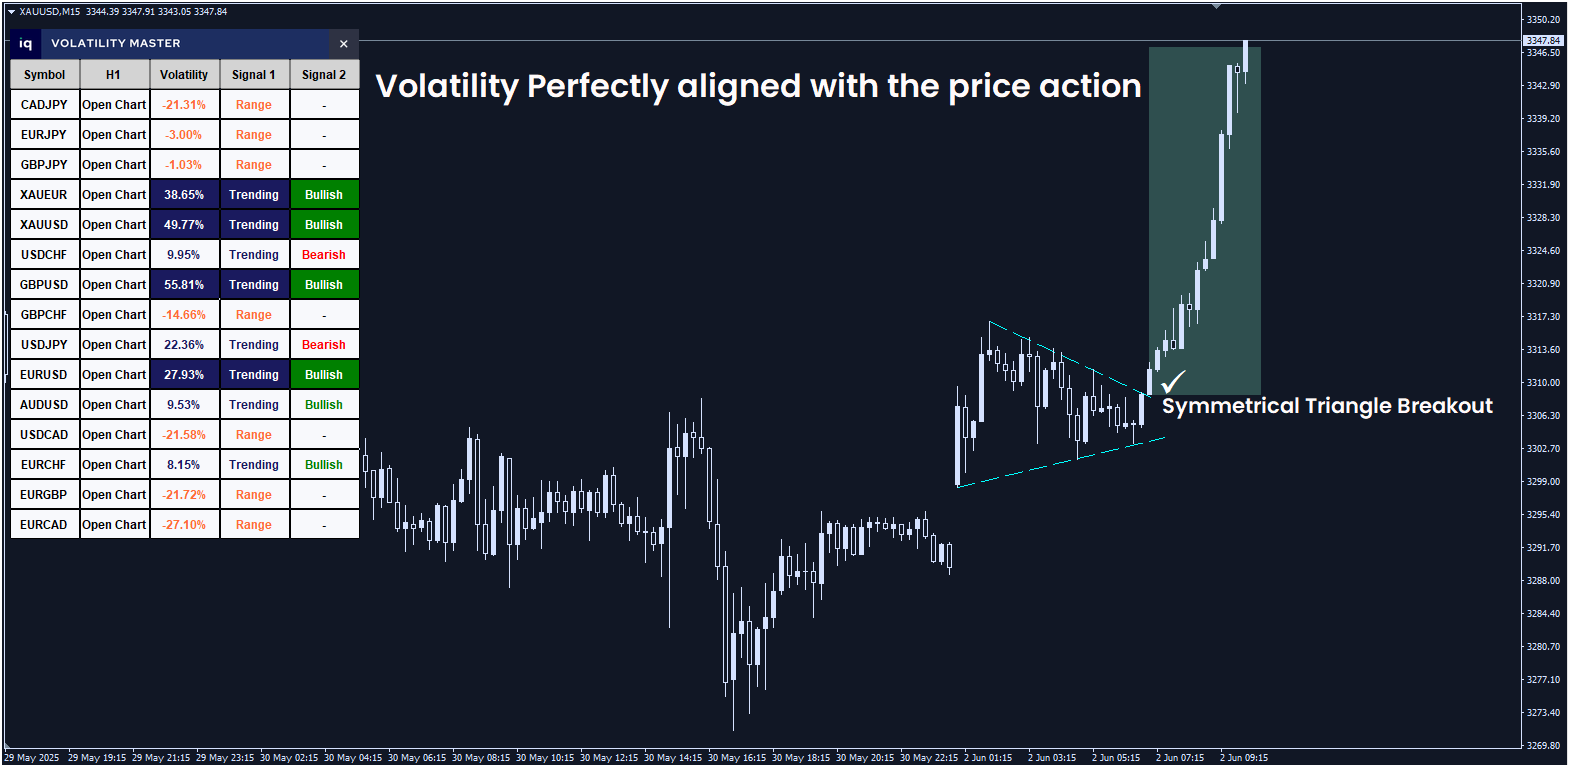
✔️ Example of a High Volatile Market:
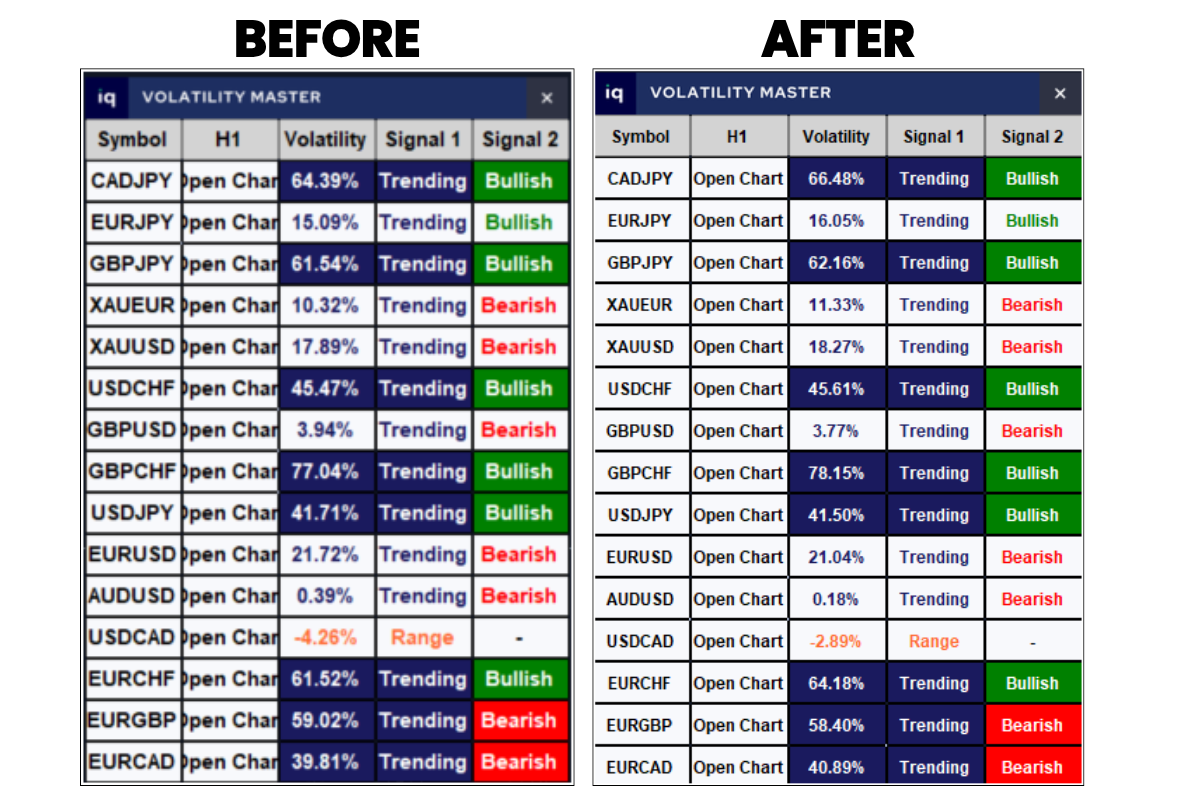
Here in the XAUUSD chart, all 3 options met the criteria, i.e., the dashboard displays a high volatility percentage (which is also increasing), along with a Trending (signal 1) and Bullish (signal 2). Hence, a perfect entry spot.
Note: It perfectly aligned with a price action pattern (symmetrical triangle) breakout.
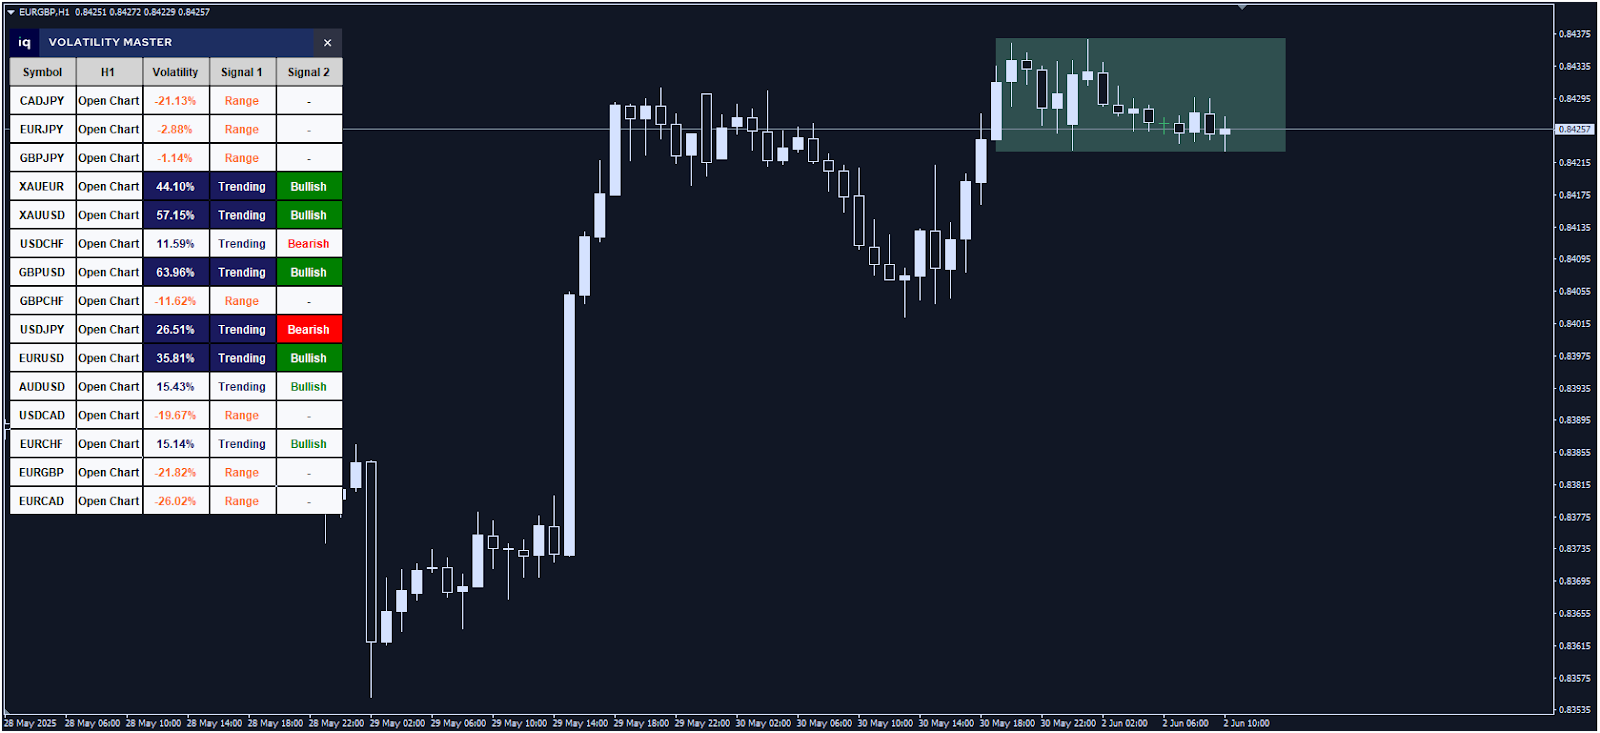
✔️ Example of a Low Volatile Market:
In the EURGBP chart, none of the 3 options met the criteria. The dashboard displays a low volatility percentage (which is negative), along with a Range signal 1 and no signal 2. Hence, NOT a perfect entry spot. A trader must avoid such pairs with zero momentum and a range market at any cost. This tool gives you a clear picture on which symbols to avoid saving you from financial loss.

Volatility Indicator: Your trading superhero!
Trading in a range market is the worst nightmare situation you can have. The pattern is fairly common every time. You notice the market is trending and moving up nicely, and you place a buy trade. But after you place your buy trade, the nightmare starts… The market starts losing momentum and falls asleep, or shall I say it dies? ☠️ You keep waiting for the market to go in your favor, and reach your target anyhow, but it just won’t. It drags the range hour after hour. That’s exactly what happens, right? Don’t worry! Because it happens with every trader out there, you are not alone; it happened to me, too. And of course, no one would want to go through that pain of hanging in there in a range market with hope in their mind! Which is why I’ve built this indicator to get us out of this misery.
That’s why gauging market volatility in advance is way more powerful than you think. Checking the volatility before placing any trade can save you both time and money, and of course, also saves you from the frustration and anxiety that come with it. You check the volatility and jump into the market when it’s trending with a good percentage (at least above 40%-50%).
➡️ Volatility Percentages:
This metric has been built to make your symbol-selection decision easier and quicker. The higher the volatility percentage, the better the symbol is to trade. This indicator lets you view the volatility percentage for any selected timeframe.
Good Signal:
When highlighted in bold, the volatility percentage indicates a trendy market, and a good trading situation.
Bad Signal:
When the signal displays range and the volatility percentage is shown in negative, you must avoid trading on this symbol during that time. The higher the negative volatility percentage, the worse the range market is. No man’s land.
Awesome, isn’t it? This indicator includes many complex calculations to make it simpler and cleaner for you.
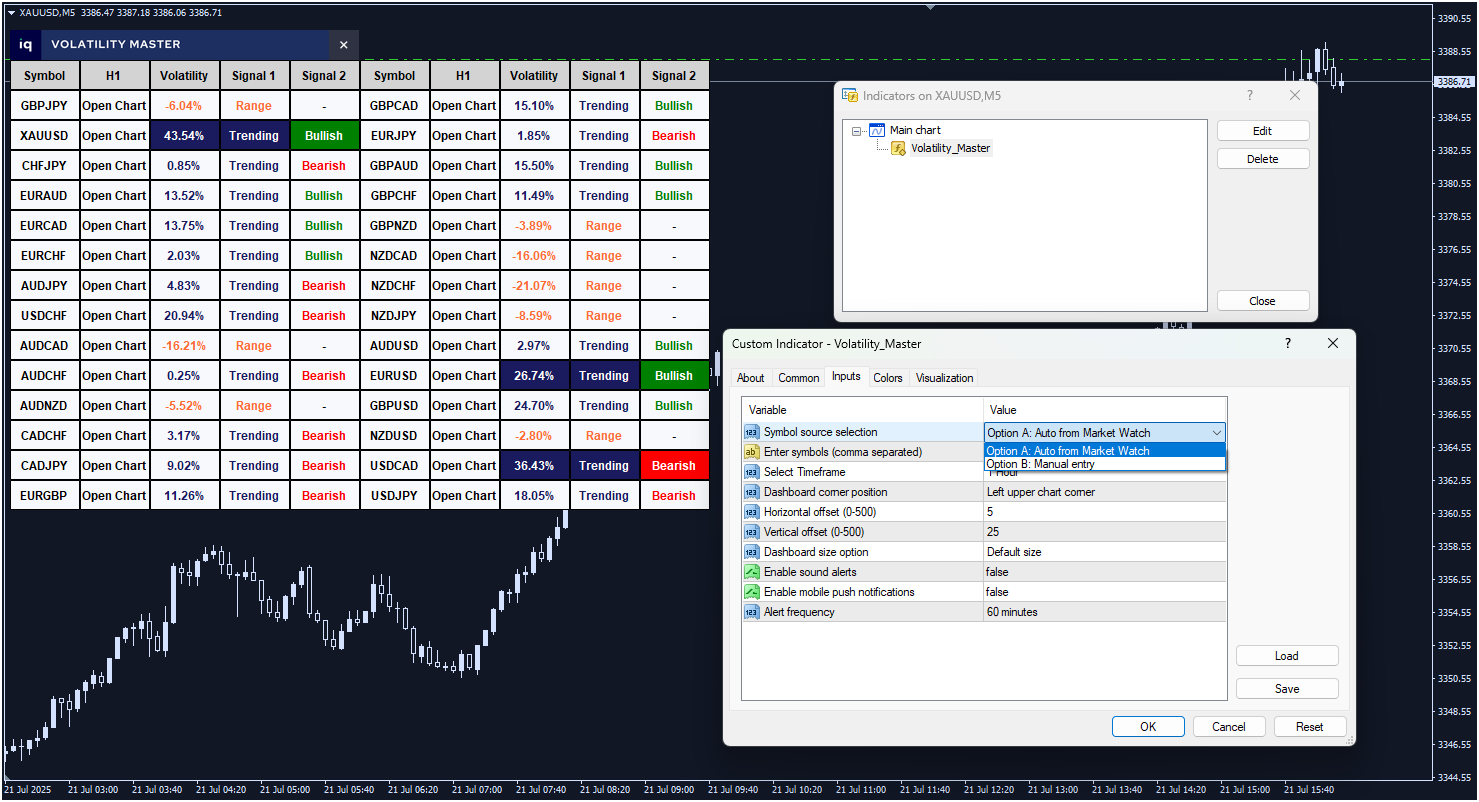
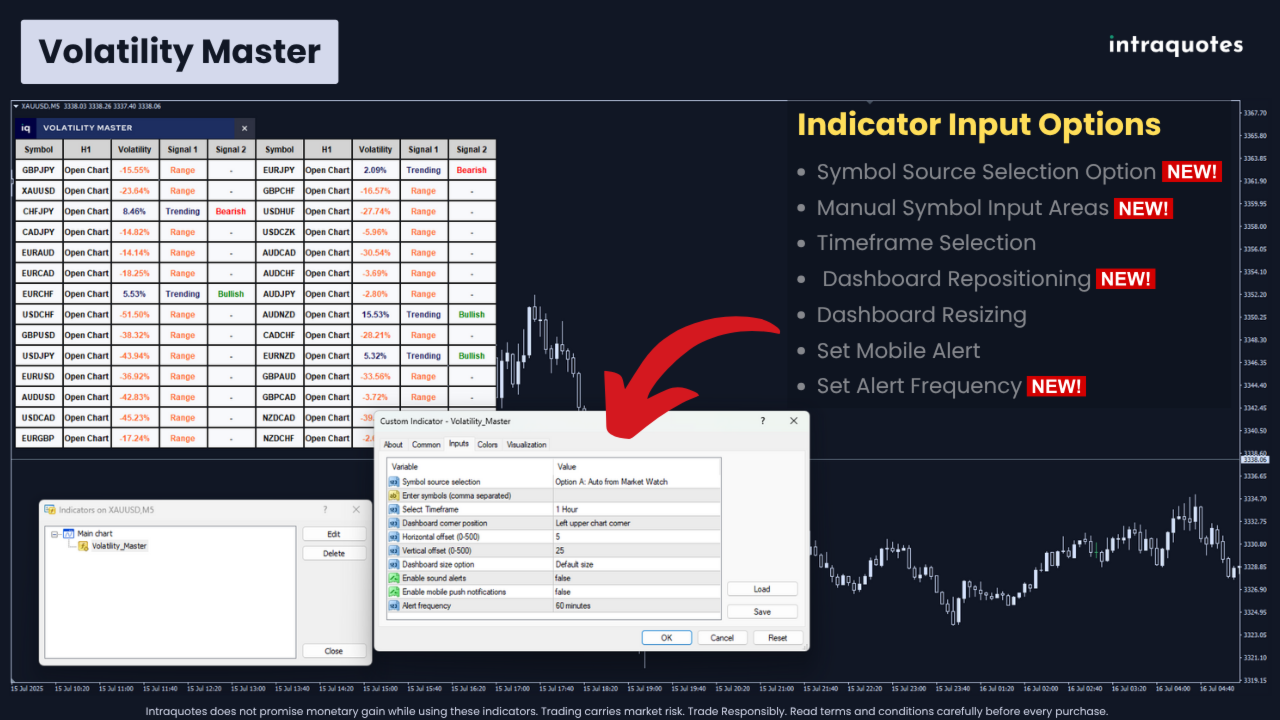
Indicator Customization
✔️ Symbol Selection:
-
By default, the indicator displays the first 28 Market Watch symbols.
-
But you can drag and adjust the symbols from the Market Watch list to display them in the indicator dashboard.
-
You can even enter up to 28 symbols manually from the input area section to display them in the indicator dashboard.
🔥Added Bonus Feature:
Now, you can add the indicator dashboard to up to 2 charts, create a dashboard list of your preferred symbols, and track the volatility of multiple assets in one go at a glance!
⚡️Bonus Tips
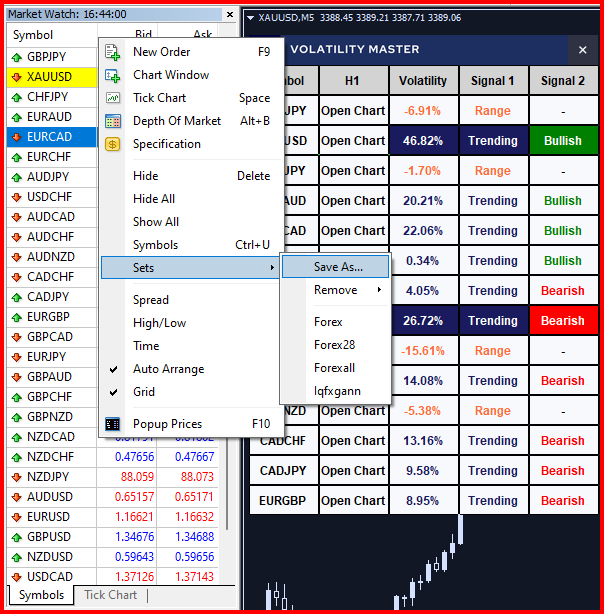
📂 Custom Market Watch List: You can also create a custom market watch list with all your favorite symbols and save it. Left-click on the market watch list-’sets’-’save as’, to save the current market watch list under your desired name. You can use the saved list for specific indicators. Open 28 preferred symbols in the market watch list, save it, and use the saved list every time you use the indicator for quicker navigation among the supported symbols. Watch this video for a quick video guide on how to save Sets.
✔️ Timeframe Adjustment:
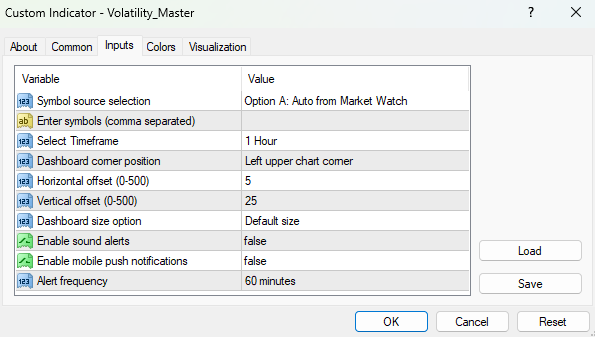
Choose between H1 (default), H4, and D1 timeframes based on your trading style.
✔️ Dashboard Resizing:
2 options available: Default and Large. Compatible with SD, HD, Full HD, and 4K monitors.
✔️ Dashboard location customization:
Now you can create a default dashboard location on the chart using the X/Y coordinate from the indicator settings. Every time you add the indicator to the chart, it will be displayed at the same location according to your chosen X/Y coordinate preference. This feature comes in handy when you are using multiple indicators in one chart.
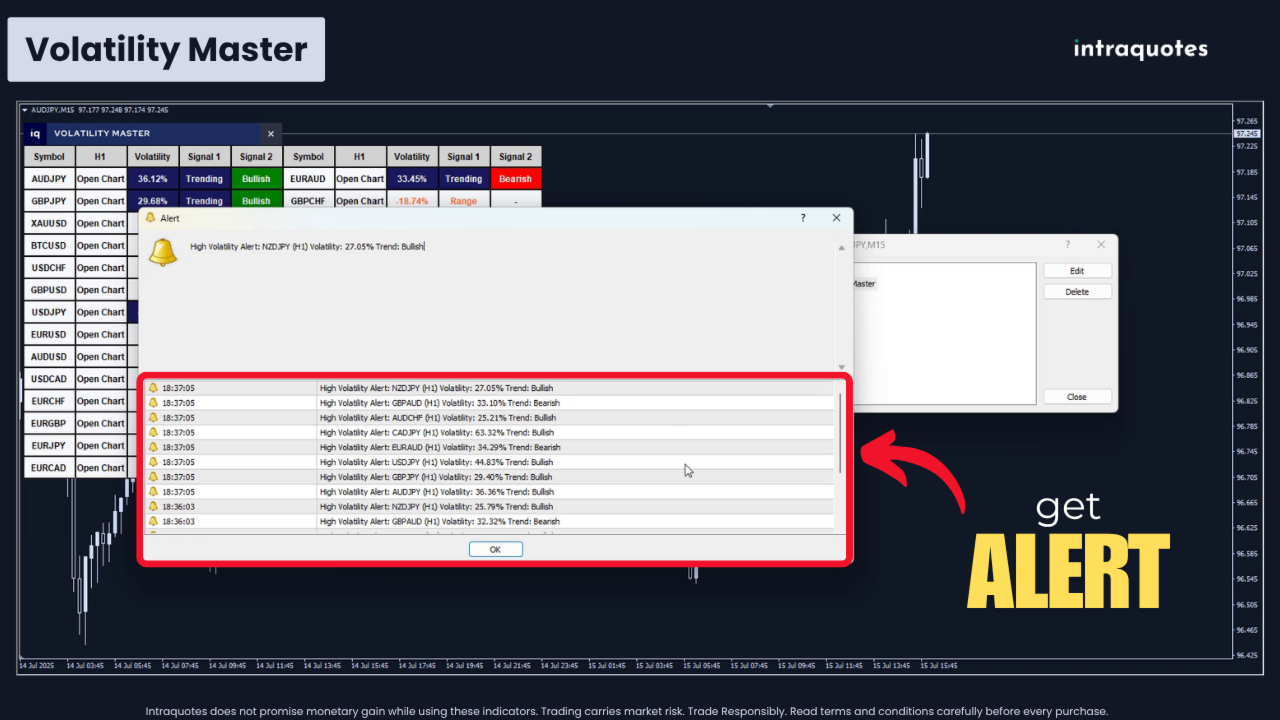
📳 Indicator Volatility Alert: (True/false)
You can get a mobile push notification alert with this indicator.
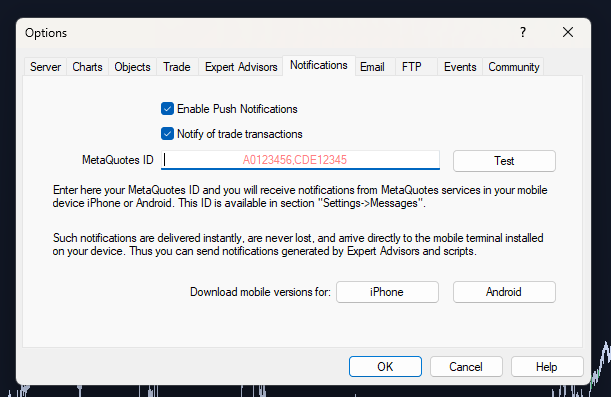
📝 Note for Mobile Alert: To receive mobile alerts for this indicator, enable push notifications in MetaTrader 4 by pressing Ctrl + O (or accessing Options) and navigating to the Notifications tab. Enter your MetaQuotes ID from the MetaTrader app on your mobile device to link it with your platform. Once connected, test the setup to ensure alerts are working.
🕵️♂️Secret Tips for this indicator
✅ Focus on symbols with high volatility percentages (greater than 50% is always a smart choice), and a Trending signal.
✅ Use D1 for long-term trades, H4 for swing trades, and H1 for intraday setups.
✅ Avoid trades during low volatility periods, or even highly volatile periods like immediately before or after a major news release.
🔥 Strategy to use this indicator with the Gann Levels and Hydra Trend Rider is coming soon… 🔖 Bookmark this link.
FAQs
❓What if the dashboard doesn’t display on the chart?
➡️ Ensure the indicator is properly installed, the Market Watch symbols are visible, and you have a stable internet connection with good speed.
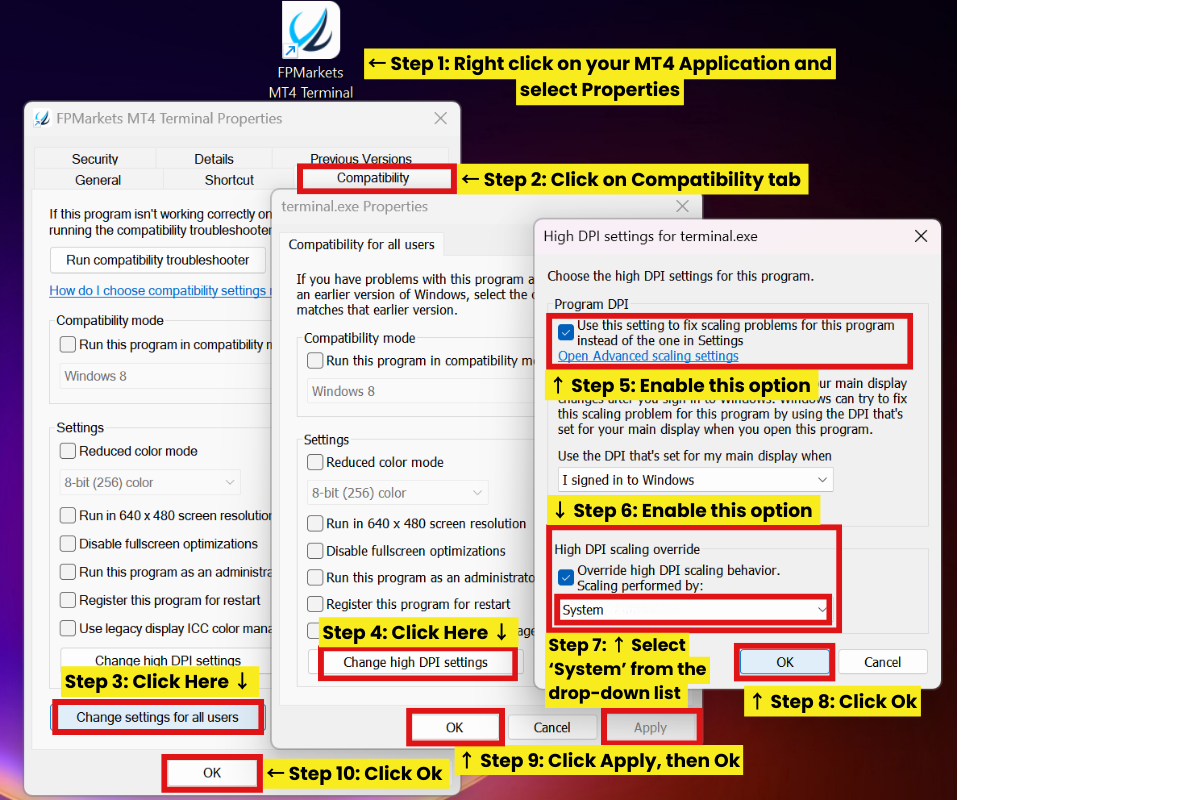
❓What if the dashboard seems squished or can’t see the data?
➡️If your indicator dashboard looks squished and you can’t read the data properly, it is due to the scaling issue of MetaTrader. Follow the simple steps explained in the picture given below to fix the issue.
Product Links: MT4 | MT5
🤝🏻 Let’s connect:
Telegram | Threads | YouTube
Disclaimer:
• Trading involves financial risk. Know all the risks before investing. Read all the Terms & conditions of each of the product pages before purchasing indicators.
• Our products are available only on mql5.com.
• We never contact anyone or sell our products privately.
• We do not provide any personal trading advice.
• We do not sell any of the Intraquotes products on Telegram or any other platform or website.
©intraquotes | DO NOT COPY THIS CONTENT
RISK DISCLOSURE
Trading financial markets carries inherent risks and may not be suitable for every investor. This indicator is designed as a tool to assist in trading decisions but does not guarantee profits or prevent losses, which could exceed your initial investment. Past performance is not a reliable indicator of future outcomes. Users are encouraged to fully understand the risks and seek independent financial advice if needed. Any trading decisions made using this indicator are at the user’s discretion and responsibility.
COPYRIGHT NOTICE
This user manual and its contents, including text, graphics, and code samples, are the exclusive property of Intraquotes. All rights reserved.
Unauthorised reproduction, distribution, modification, or use of this document, in whole or in part, without prior written permission from the copyright owner, is strictly prohibited. This document is provided exclusively to verified buyers of the associated indicator on MQL5.com. Sharing or distributing this document to others is a violation of copyright law.
The information provided in this manual is for personal use only and is intended to assist with the use of the associated indicator. The author assumes no responsibility for any misuse of this material or any trading decisions made based on its contents.